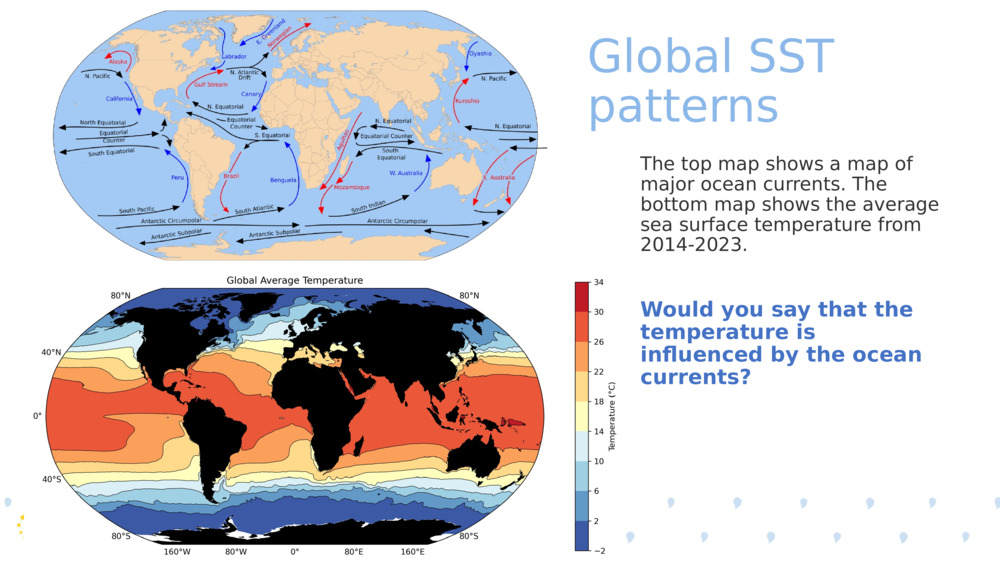
The top map shows a map of major ocean currents. The bottom map shows the average sea surface temperature from 2014-2023.
The top map shows a map of major ocean currents. The bottom map shows the average sea surface temperature from 2014-2023.
The top map shows a map of major ocean currents. The bottom map shows the average sea surface temperature from 2014-2023. Would you say that the temperature is influenced by the ocean currents? Global SST patterns

Original Slide Deck: Measuring temperature from space
Topics: Ocean. Climate. Ocean Temperature.
Suitable Ages: 8. 9. 10. 11. 12. 13. 14. 15. 16.
Keywords: Climate. Satellite. Temperature.
Uploaded By: pml-admin
Number of bundles using this content: 2
Licensed under CC BY 4.0
This content has been used in the following resource bundles:
Measuring temperature from space
This resource bundle contains materials that describe how and why sea ...
View BundleMeasuring temperature from space
This resource bundle contains materials that describe how and why sea ...
View Bundle