Explore Sea Surface Temperature time series
Explore Sea Surface Temperature time series
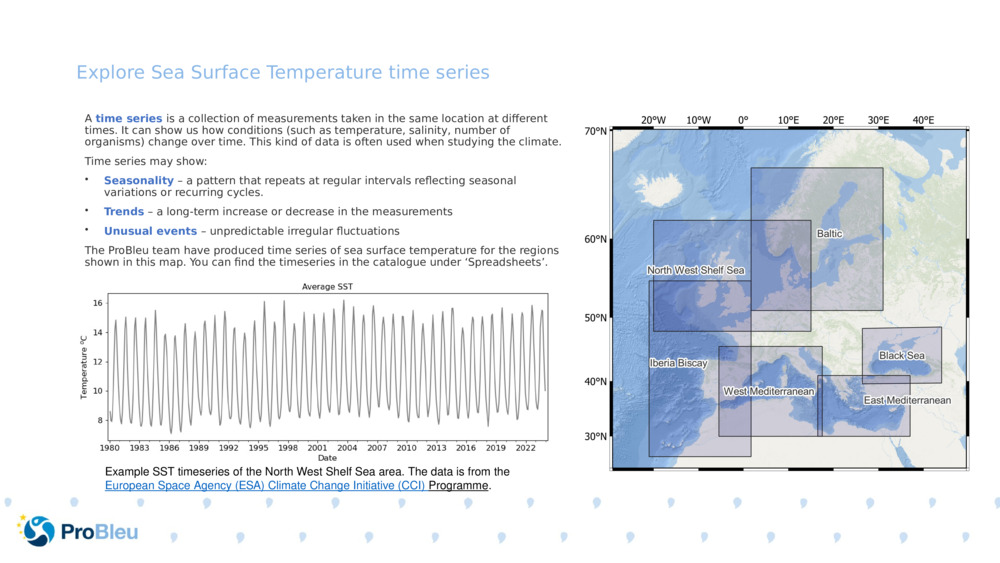
Explore Sea Surface Temperature time series A time series is a collection of measurements taken in the same location at different times. It can show us how conditions (such as temperature, salinity, number of organisms) change over time. This kind of data is often used when studying the climate. Time series may show: Seasonality – a pattern that repeats at regular intervals reflecting seasonal variations or recurring cycles. Trends – a long-term increase or decrease in the measurements Unusual events – unpredictable irregular fluctuations The ProBleu team have produced time series of sea surface temperature for the regions shown in this map. You can find the timeseries in the catalogue under ‘Spreadsheets’. Example SST timeseries of the North West Shelf Sea area. The data is from the European Space Agency (ESA) Climate Change Initiative (CCI) Programme .

Original Slide Deck: Exploring satellite sea surface temperature data
Topics: Ocean. Climate. Ocean Temperature.
Suitable Ages: 10. 11. 12. 13. 14. 15. 16. 17. 18.
Keywords: Satellite. Temperature.
Uploaded By: pml-admin
Number of bundles using this content: 2
Licensed under CC BY 4.0
This content has been used in the following resource bundles:
Measuring temperature from space
This resource bundle contains materials that describe how and why sea ...
View BundleMeasuring temperature from space
This resource bundle contains materials that describe how and why sea ...
View Bundle