Activity: Design an infographic
Activity: Design an infographic
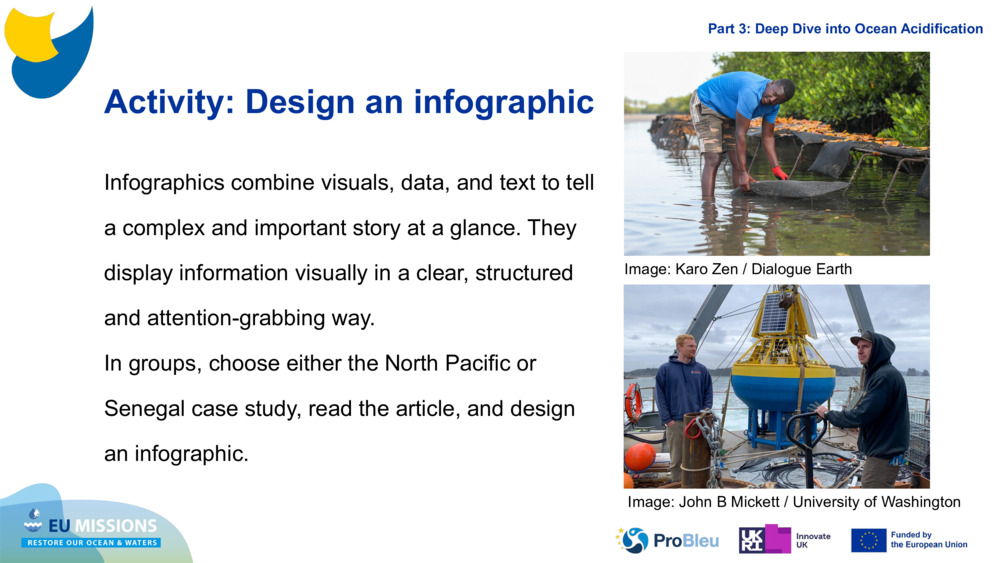
Activity: Design an infographic Infographics combine visuals, data, and text to tell a complex and important story at a glance. They display information visually in a clear, structured and attention-grabbing way. In groups, choose either the North Pacific or Senegal case study, read the article, and design an infographic. Image: Karo Zen / Dialogue Earth Image: John B Mickett / University of Washington Part 3: Deep Dive into Ocean Acidification
Original Slide Deck: Water Chemistry with Plymouth Marine Laboratory
Topics: Sustainable Resources. Deoxygenation. Ocean. Freshwater. Ocean Chemistry. Nutrient Pollution.
Suitable Ages: 12. 13. 14. 15. 16. 17. 18.
Keywords: Acidity. Alkalinity. Biology. Carbon. Carbon Dioxide. Chemical Reactions. Chemistry. Eutrophication. Farming. Hypoxia. Indicators. Molecules. Nutrients. Ocean Acidification. Ph.
Uploaded By: pml-admin
Number of bundles using this content: 1
Licensed under CC BY 4.0
This content has been used in the following resource bundles:

Water Chemistry with Plymouth Marine Laboratory
Teaching about water chemistry is important because it connects key sc...
View Science Story