Notes on creating an infographic
Notes on creating an infographic
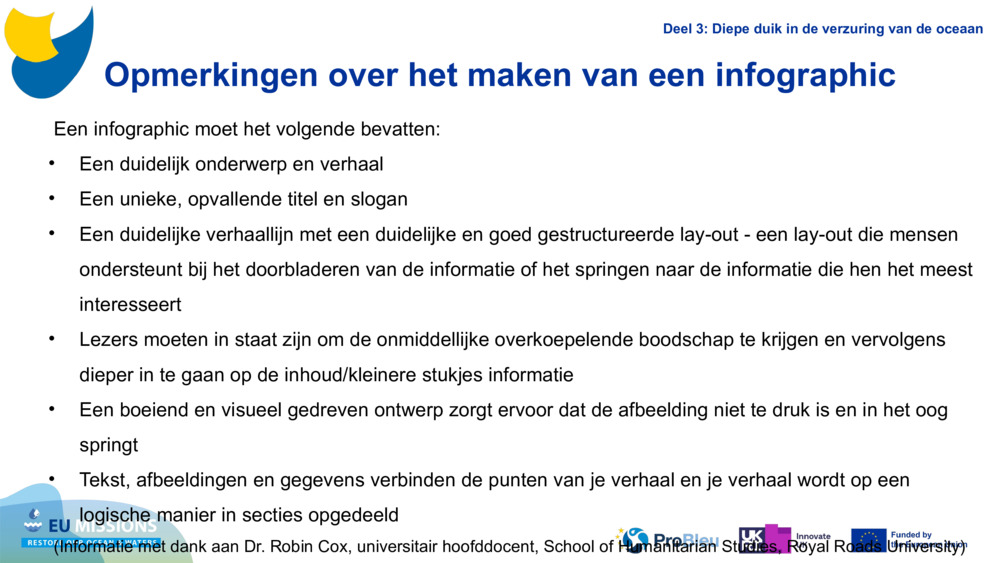
Notes on creating an infographic An infographic should have: A clear subject and story A unique, attention-grabbing title and tagline A clear storyline with a clean and well-structured layout – a layout that supports people browsing the information or jumping to the information that interests them the most Readers should be able to get the immediate over-arching message and then be able to dig deeper into the content/smaller chunks of information An engaging and visually-driven design ensuring the graphic is not too crowded and is eye-catching Text and images and data connect the dots of your story and your story is chunked into sections in a way that makes sense (Information courtesy of Dr. Robin Cox, Associate Professor, School of Humanitarian Studies, Royal Roads University) Part 3: Deep Dive into Ocean Acidification

Originele diapresentatie: Water Chemistry with Plymouth Marine Laboratory
Onderwerpen: Duurzame hulpbronnen. Deoxygenatie. Oceaan. Zoet water. Chemie van de oceaan. Vervuiling door voedingsstoffen.
Geschikte leeftijden: 12. 13. 14. 15. 16. 17. 18.
Trefwoorden: Alkaliteit. Biologie. Chemische reacties. Eutrofiëring. Hypoxie. Indicatoren. Kooldioxide. Koolstof. Landbouw. Moleculen. Ph. Scheikunde. Verzuring van de oceaan. Voedingsstoffen. Zuurgraad.
Geüpload door: pml-admin
Aantal bundels met deze inhoud: 1
Licensed under CC BY 4.0
Deze inhoud is gebruikt in de volgende bronbundels:
Waterchemie met Plymouth Marine Laboratory
Lesgeven over waterchemie is belangrijk omdat het belangrijke wetensch...
Bekijk het wetenschappelijke verhaal