Notes on creating an infographic
Notes on creating an infographic
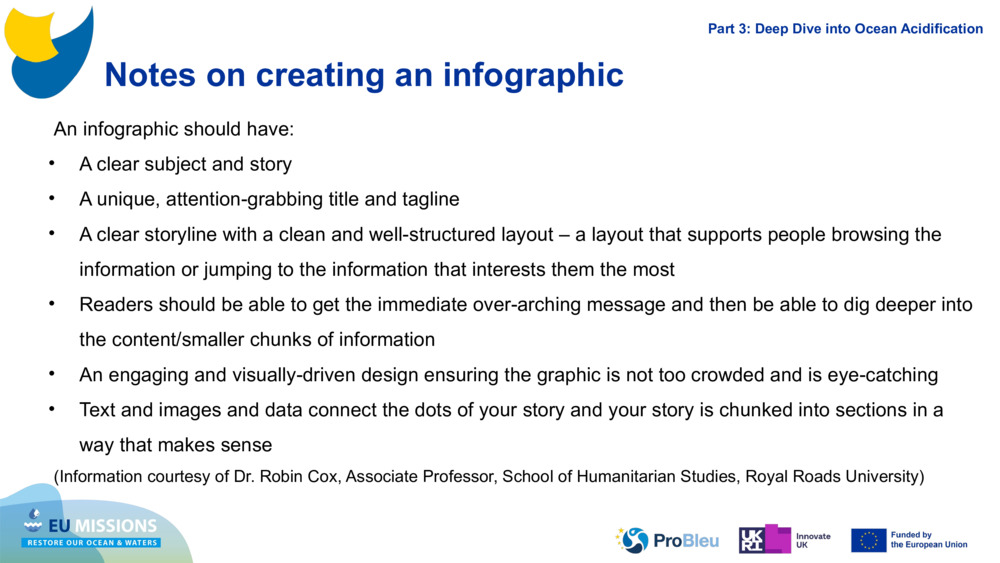
Notes on creating an infographic An infographic should have: A clear subject and story A unique, attention-grabbing title and tagline A clear storyline with a clean and well-structured layout – a layout that supports people browsing the information or jumping to the information that interests them the most Readers should be able to get the immediate over-arching message and then be able to dig deeper into the content/smaller chunks of information An engaging and visually-driven design ensuring the graphic is not too crowded and is eye-catching Text and images and data connect the dots of your story and your story is chunked into sections in a way that makes sense (Information courtesy of Dr. Robin Cox, Associate Professor, School of Humanitarian Studies, Royal Roads University) Part 3: Deep Dive into Ocean Acidification

Original bildspel: Water Chemistry with Plymouth Marine Laboratory
Ämnen: Hållbara resurser. Syrebrist. Ocean. Sötvatten. Havets kemi. Föroreningar av näringsämnen.
Lämpliga åldrar: 12. 13. 14. 15. 16. 17. 18.
Nyckelord: Alkalinitet. Biologi. Eutrofiering. Försurning av haven. Hypoxi. Indikatorer. Kemi. Kemiska reaktioner. Kol. Koldioxid. Lantbruk. Molekyler. Näringsämnen. PH. Surhet.
Uppladdad av: pml-admin
Antal paket som använder det här innehållet: 1
Licensed under CC BY 4.0
Det här innehållet har använts i följande resurspaket:
Vattenkemi med Plymouth Marine Laboratory
Undervisning om vattenkemi är viktig eftersom den kopplar samman vikti...
Läs mer om vetenskapen